Yesterday was the conclusion of a nine month pursuit… I’ve run 2021 kilometers in 2021! For the metric-challenged, that’s 1,256 miles – an average of over 4 miles per day since January 1st.
This recklessness is known as “Kilometers vs The Year“, and this year is the fifth year that I’ve attempted it. Not counting future 2021 mileage, I’ve logged a total of 12,000 kilometers in the last five years of chasing this goal – more than twice my total running distance of the previous five years.
Kilometers vs The Year isn’t an original idea, but I’d be underselling it if I said that it hasn’t completely changed my relationship with running. It’s helped me overcome one of my biggest struggles with the sport, which is staying motivated over an extended period of time. It’s specifically disrupted the cycle of Lazy Winters → Out Of Shape Springs → Injured Summers → Finally Enjoying The Run Falls.
All it took was the theory of gamification, a spreadsheet with a time series chart, and data. And for Tom Hebner to believe that there had to be a better way – the idea was well and truly his. As simple as it might seem, to this day it’s still more motivating and insightful and addicting (to me) than anything Strava has offered.
It amazes me that this much personal running data is at my fingertips in the first place. So I spent some time making sense of it this year. Here’s what it had to say.
2017: DADS ON THE RUN
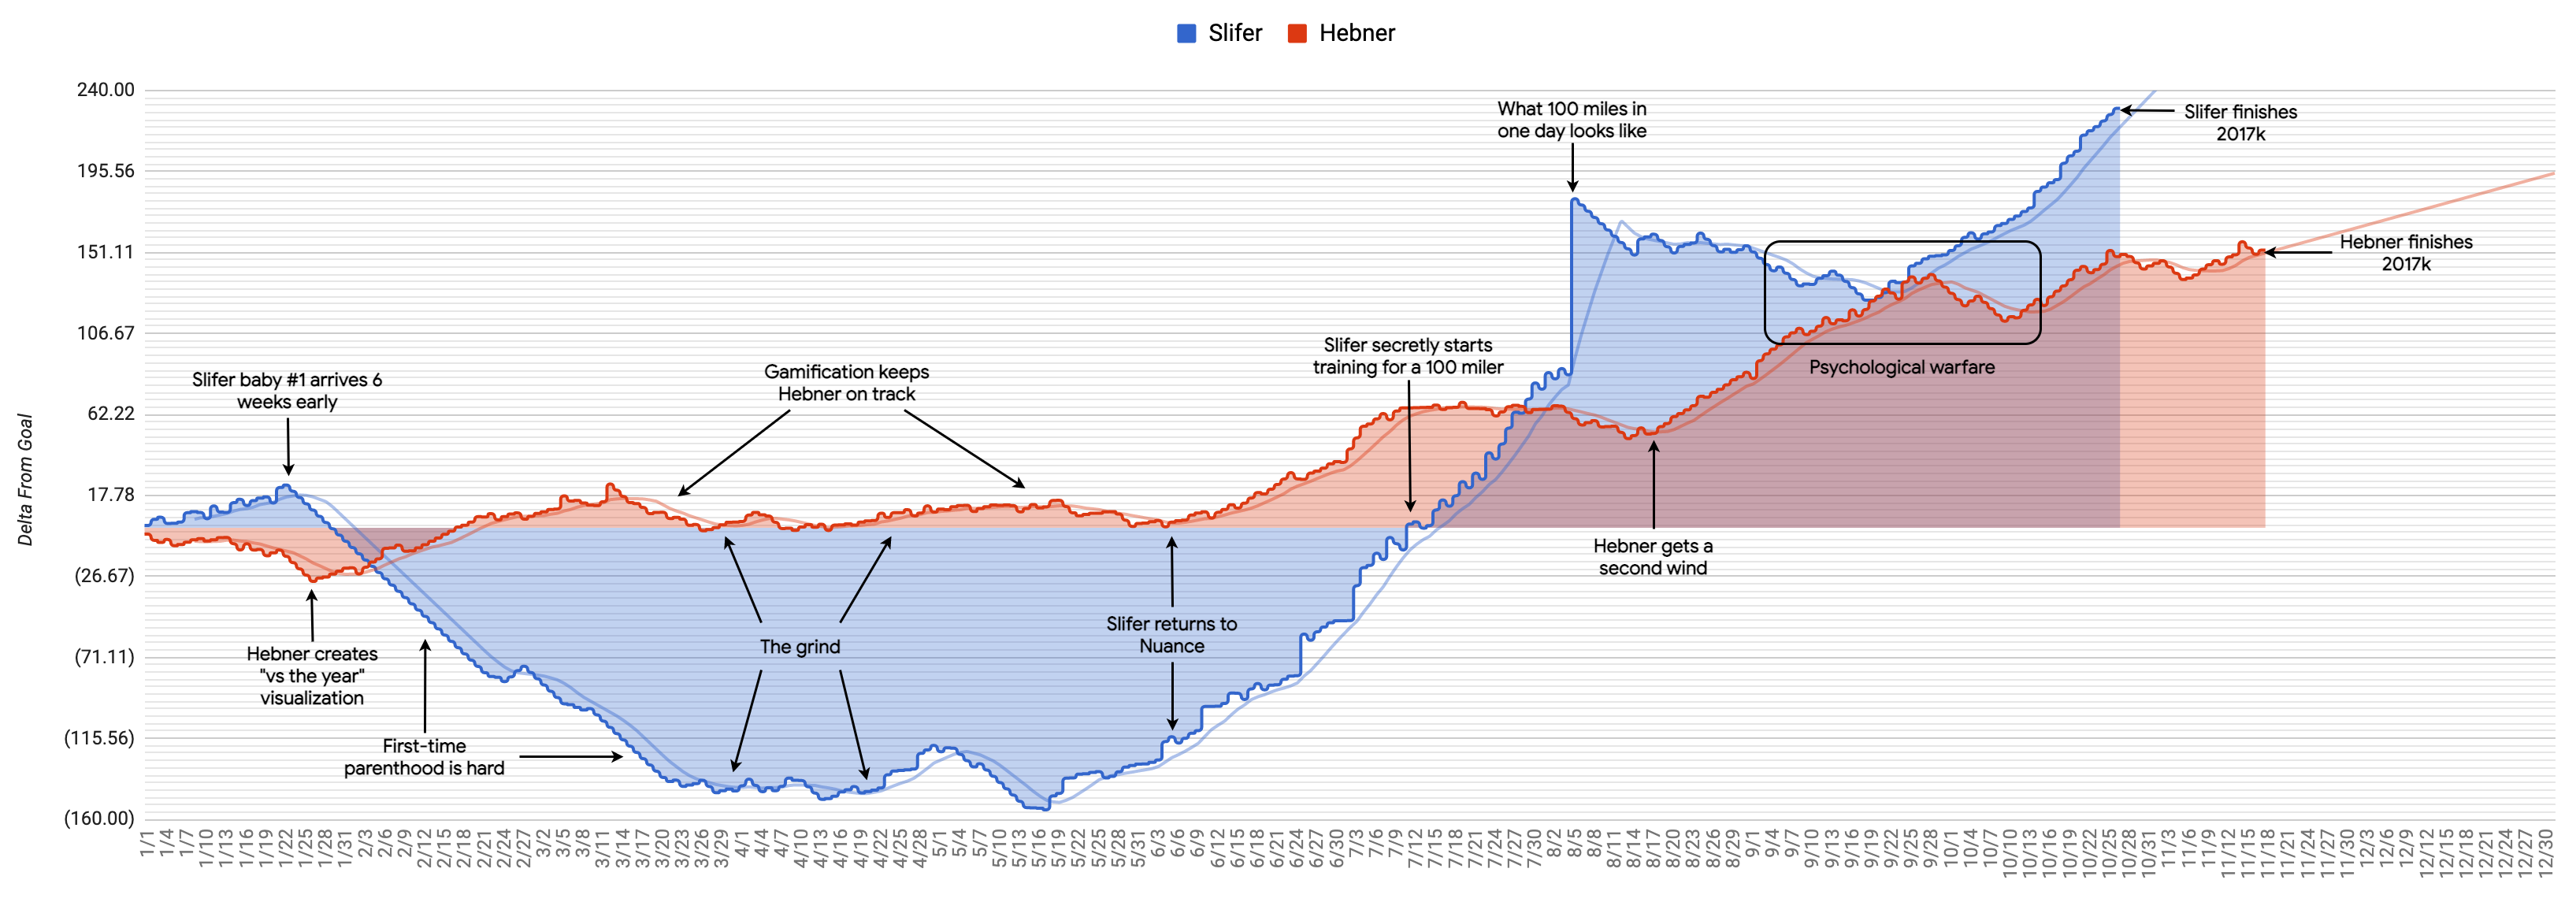
It all started as a friendly competition between Hebner and I to see if we could run 2017k in 2017. I was gearing up to be a first-time dad in March, and Tom was already 6 kids deep – so it become aptly named “Dads on the Run.”
We started the year with a copy of a spreadsheet that we’d used in the past to track mileage on a monthly basis. What I love the most about this prehistoric sheet is the “before” view that it shows – it proves the point when I say that this idea was transformational.
After getting off to a strong start, my first daughter arrived 6 weeks early and turned my life upside down, which led to a pretty big running deficit over the next few months. Hebner was running consistently, but falling behind. How far behind relative to the goal was unclear. Enter the brilliant idea.
Follow the math: in order to run 2017k in exactly 365 days, you must run 5.5k every single day. Anything more, and you inch ahead. Take a rest day, and you fall behind by a full 5.5k. A change in progress is at stake every day. This is time series data that’s perfect for visualization. And once you see it, there’s immediate tension to get moving on a daily basis. Running, meet gamification.
The impact that this had on Hebner’s running is clear. It motivated him stay ahead of “the year”, and it eventually motivated me to take drastic action to close the gap between us by covertly training for and running a 100 mile ultramarathon. When I started working for Nuance in June, the chart became a centerpiece in the office where we both worked. A week wouldn’t go by without Hebner having this up on a projector somewhere telling the story as it unfolded.
Gamification made running a lot of miles over a long period of time enjoyable. It got two dads on the run, and we both met the goal.
2018: OUT OVER MY SKIS

Hebner went on a hiatus after 2017, but I was hooked. What’s missing from the original 2017 chart is that I continued my running streak straight through to the end of the year. The KEYS100 was on my mind, and training over the winter with the spreadsheet as motivation seemed like a good idea. Working with a single dataset provided the visual capacity to add a new dimension: pace. This shows a subjective quality of the runs, as well as an indication of their frequency.
2018 ended up being a challenging year. I ran too much, too fast, without adequate rest. The result was a pubis injury from overuse that punished me for the remainder of the year. The KEYS100 went out of reach, though I did end up slogging through the NJ Marathon in April.
The day after the marathon, I started a new job with Taos that required a lot of travel and a substantial time investment in upskilling. Running took a back seat, and I didn’t reach 2018k – but it was still a high mileage year.
2019: A SECOND WIND
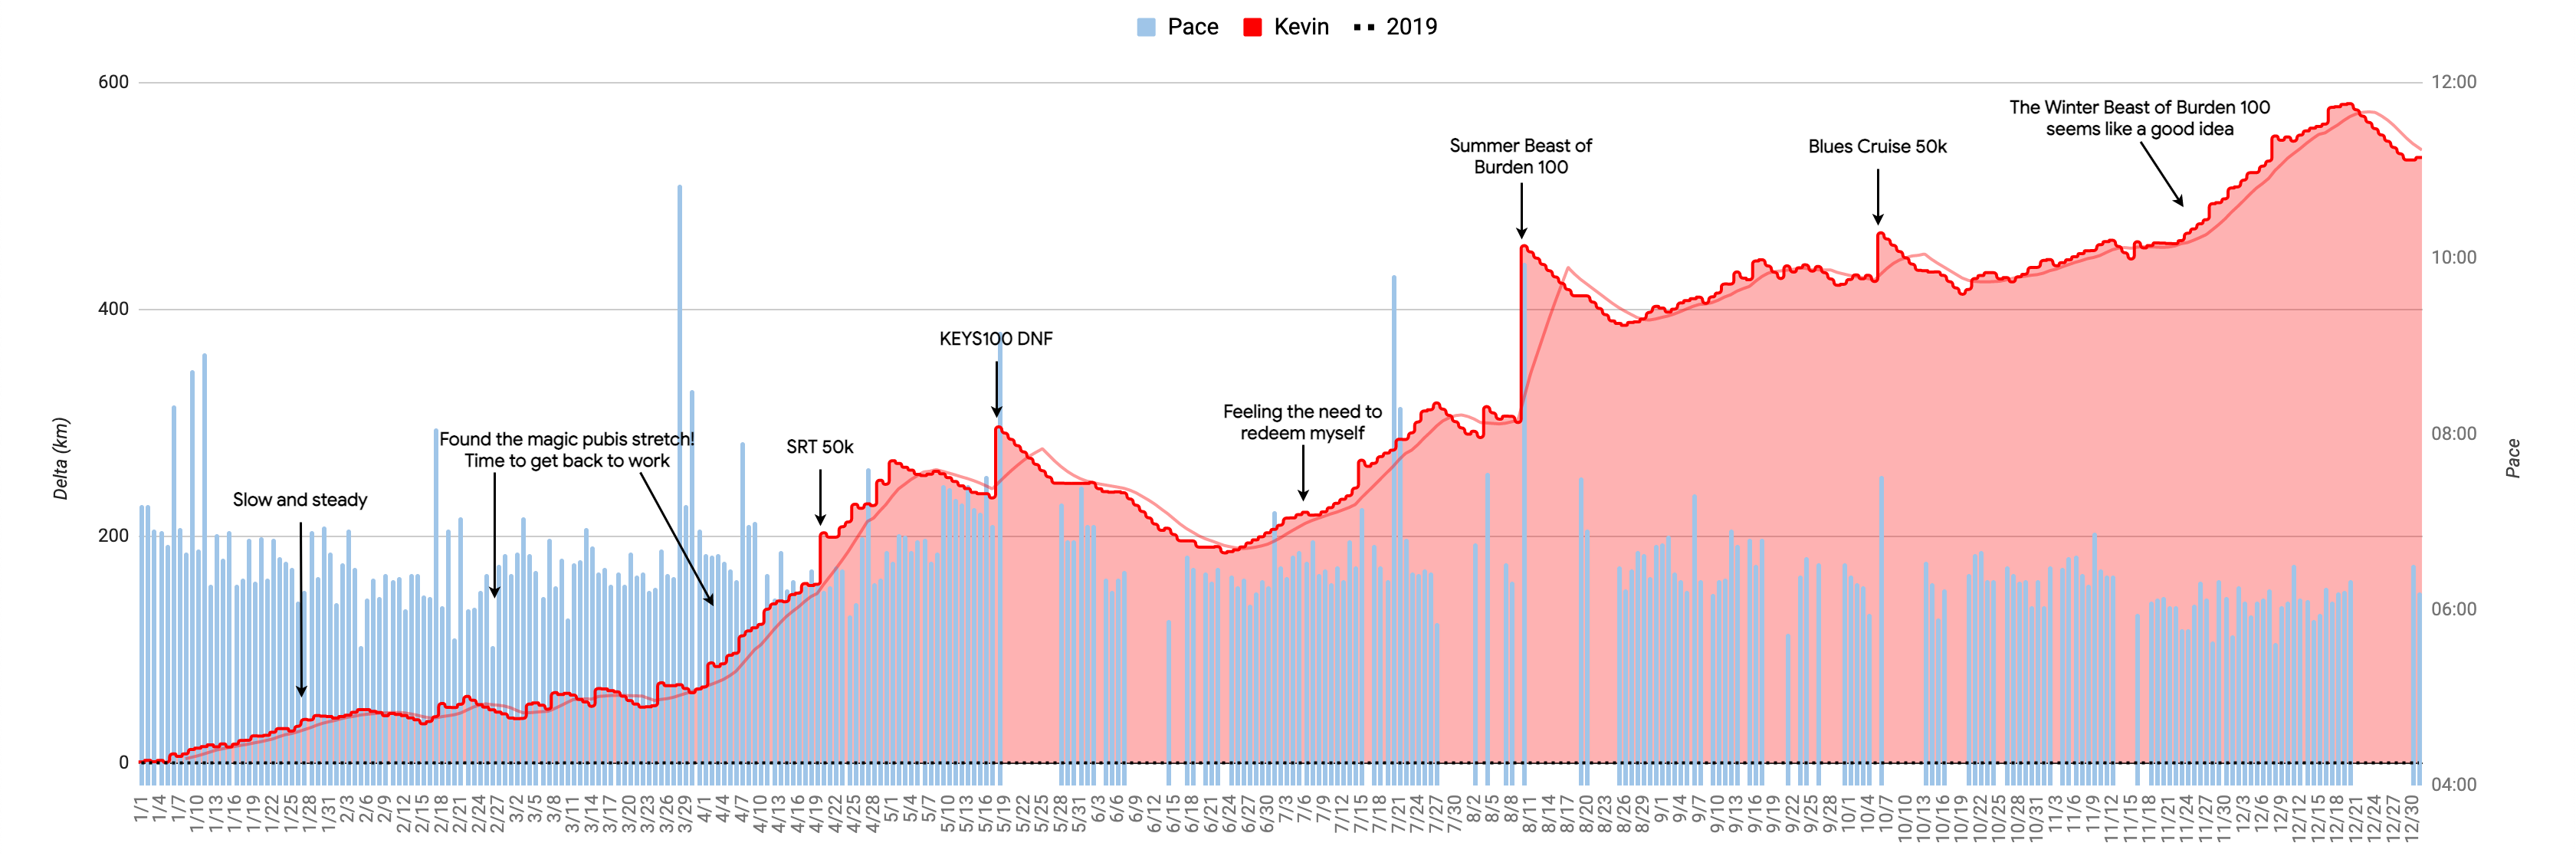
I started 2019 with the determination to work through the pubis injury. The plan of attack was essentially a diagnostics exercise: keep the runs casual and frequent, try new stretches every few days, and take notes. This trial and error is frustrating, but an excellent lesson in developing the skill of listening to your body.
I no longer recall the exact stretch that hit the spot, but it traced back to tight/weak glutes and hip flexors, which seem to be the root cause of every injury that I ever have.
As soon as that breakthrough occurred, I registered for the KEYS100 and started to layer in longer runs, culminating in the SRT 50k. The KEYS100 sadly was a flop, but I eventually swung back with a Summer Beast of Burden, a Blues Cruise 50k, and then went straight into training for a Winter Beast of Burden in February.
All in, 2019 was an amazing running year; nothing but up and to the right.
2020: COVID KILOMETERAGE

2020 started out on positive note. I was dialed in for my first winter ultramarathon, a brutal race that took almost a month to recover from.
Around that time, the world realized that COVID-19 was kind of a big deal, and months of lockdown ensued. After catching a mystery virus in March while I was on a work trip to New York… there wasn’t much else to do but run. Though it wasn’t even clear if it was an approved activity at the time.
The lack of the normal daily grind dramatically increased the consistency of running. In-person racing was effectively canceled for the foreseeable future, but I did squeeze in a virtual Summer Beast of Burden DNF, a virtual “KEYS100 in 10 days”, and a virtual Memphis Marathon.
Even a job change to EPAM and the birth of my second daughter didn’t disrupt the routine too much. 2020 was the highest mileage year of this series, and the monotony of a pandemic drove me to make some serious headway on my LifeMap.
2021: DADS ON THE RUN RETURNS
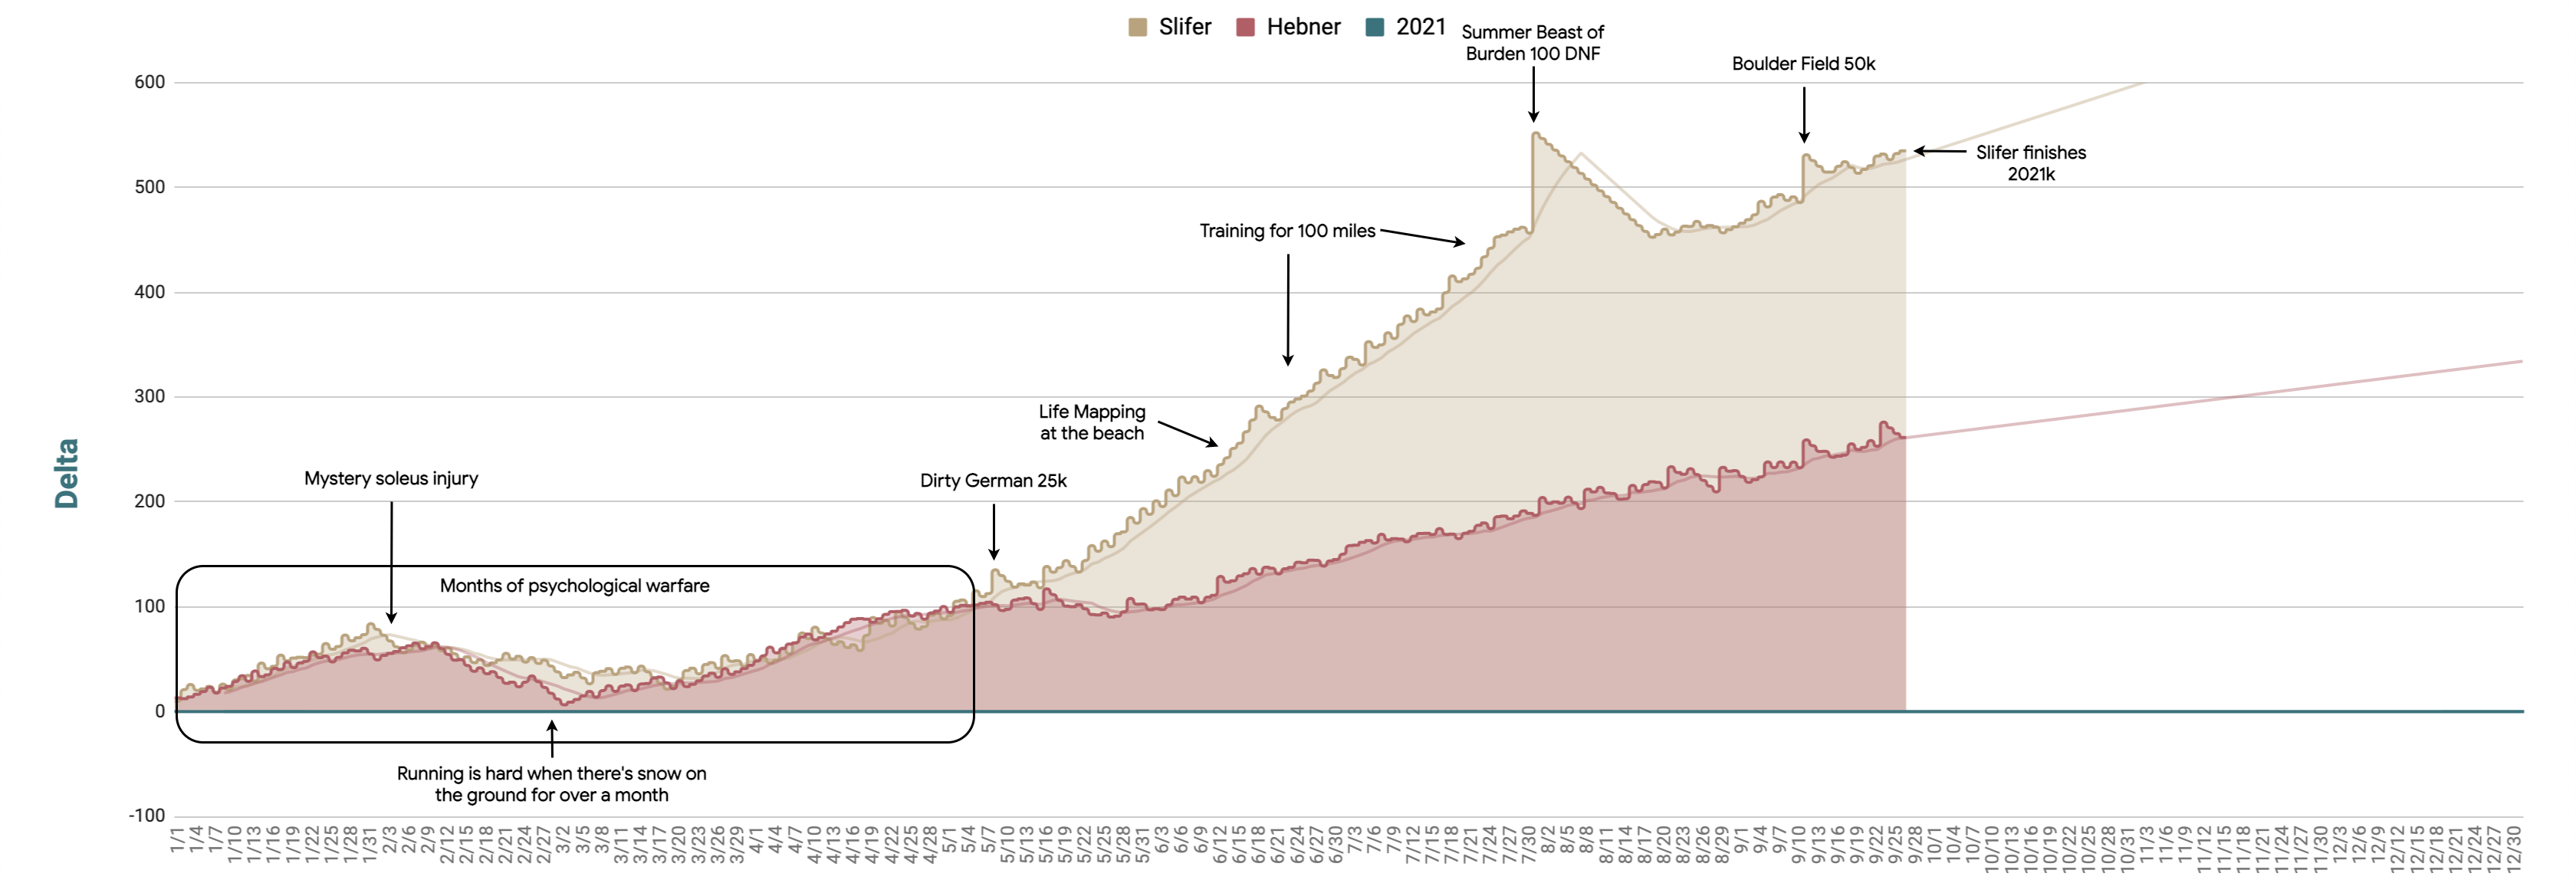
This year saw a full return of Dads on the Run with Hebner! Some much-needed improvement was made to the spreadsheet: a retro color scheme, and fully automated data entry of our Strava runs.
The first four months of the year were a grind. The northeast received an excessive amount of snow that refused to melt, which made winter running as difficult as it can get. I was also dealing with soleus pain that I couldn’t (and still can’t) diagnose. And having two kids made it pretty hard to get out for longer runs on a regular basis.
A major breakthrough came in May when the first real mileage test of the year, the Dirty German 25k, made my soleus neither better or worse – so I decided to pull a Hebner and “just fucking run” (JFR) from there to see what would happen.
JFR is exactly what happened. Life Mapping at the beach, another 100 mile DNF (ugh), and a Boulder Field 50k with minimal additional training. My soleus still hurts, but it held up through a pretty rigorous summer of training.
And now I’m done with 2021k, but still running – and Hebner is getting closer to done every day as he trains for his first marathon attempt at the NYC Marathon in November.
THE MACRO VIEW

Zooming out on this five year journey puts things into a different perspective. Individual runs have less importance, with only the giant uptick of an ultramarathon being noticeable at all. What becomes more clear are the swings in momentum that take months of consistent running to play out. And it almost looks like my pace has improved…
Probably the most important change that has occurred over the last 12,000 kilometers is that running has become a normal occurrence. It just gets done, no matter how I feel, what time of day it is, or what the weather is like outside. There aren’t many excuses that I allow myself to use anymore.
This spreadsheet is responsible for a lot. I’m disciplined. I’m healthy. I’ve been in the right place at the right time to see some pretty cool stuff, and forged some new bonds along the way.
What’s in store for 2022? It’s hard to say for sure, but definitely a shot at 2022k, hopefully some soleus relief, and maybe some elevation. The chart is going to need a new dimension to gamify hill repeats. Maybe I’ll get around to moving all of this into Data Studio.